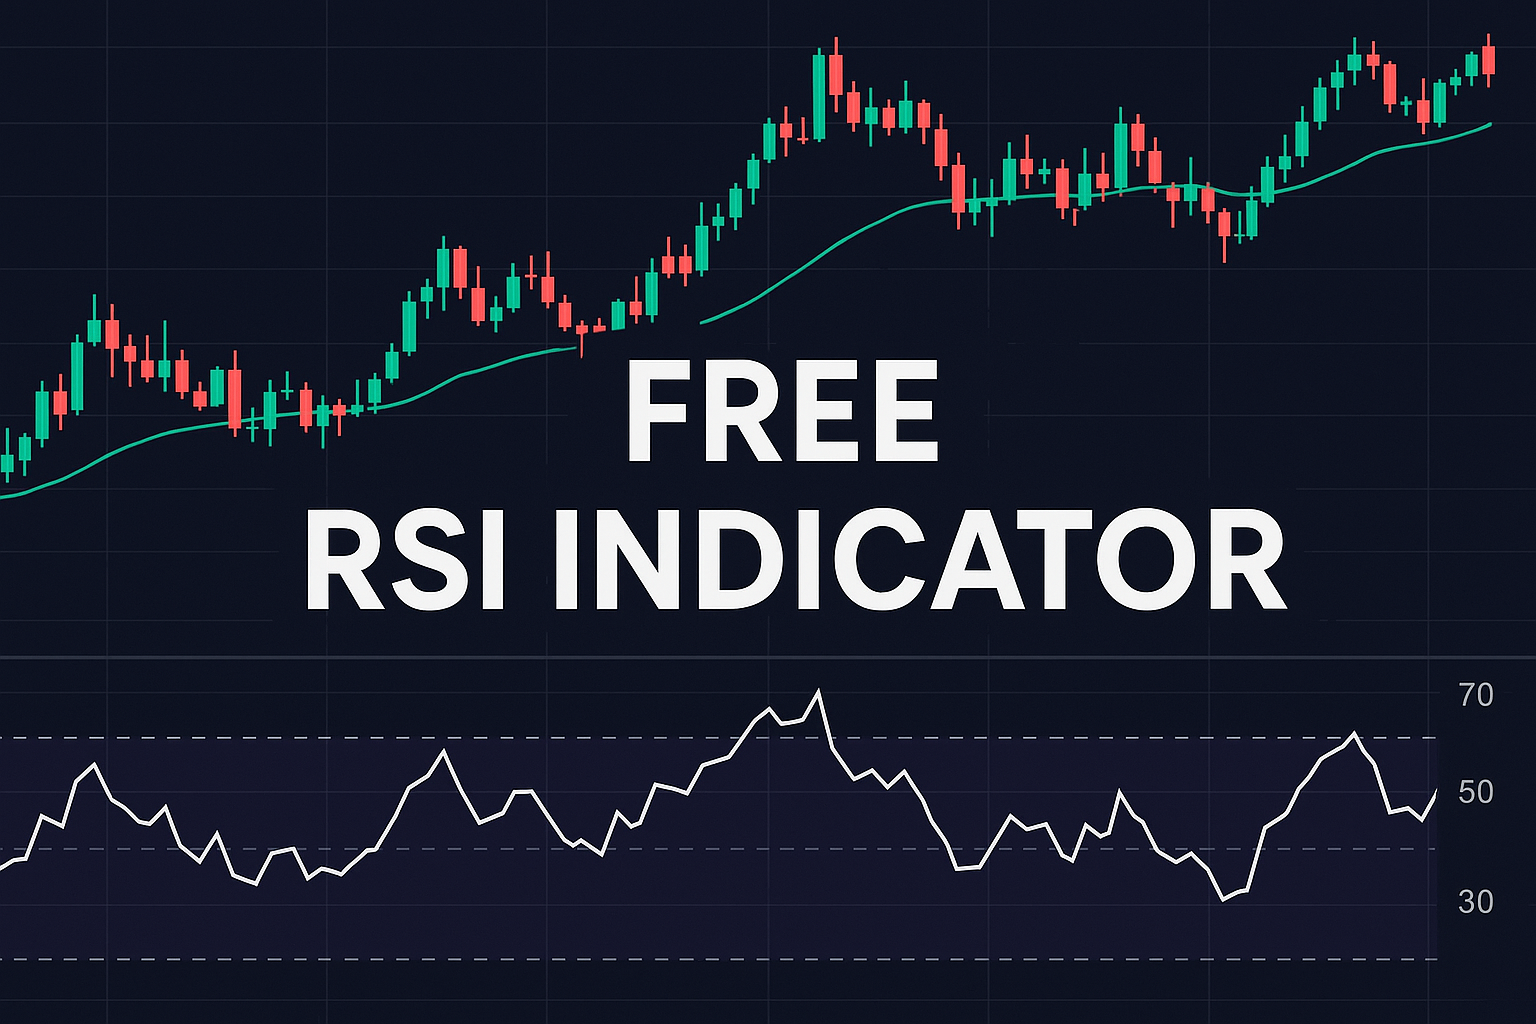
Free RSI Indicator PDF – Download the Ultimate Beginner’s Guide
New to RSI and want a simple, offline resource to learn from? We’ve created a free, easy-to-follow RSI Indicator PDF that explains how RSI works, how to use it, and how to apply it to your trades — whether you’re trading stocks, crypto, forex, or futures. What’s Inside the RSI PDF? ✅ What is RSI and how it works✅ RSI formula explained in simple terms✅ Buy and sell signal examples✅ Best settings for different markets✅ RSI strategies for beginners✅ Pro tips for avoiding false signals✅ Chart examples (with entry/exit setups) This PDF is perfect for beginners who want to learn
Free RSI Indicator PDF – Download the Ultimate Beginner’s Guide
New to RSI and want a simple, offline resource to learn from? We’ve created a free, easy-to-follow RSI Indicator PDF that explains how RSI works, how to use it, and how to apply it to your trades — whether you’re trading stocks, crypto, forex, or futures. What’s Inside the RSI PDF? ✅ What is RSI and how it works✅ RSI formula explained in simple terms✅ Buy and sell signal examples✅ Best settings for different markets✅ RSI strategies for beginners✅ Pro tips for avoiding false signals✅ Chart examples (with entry/exit setups) This PDF is perfect for beginners who want to learn
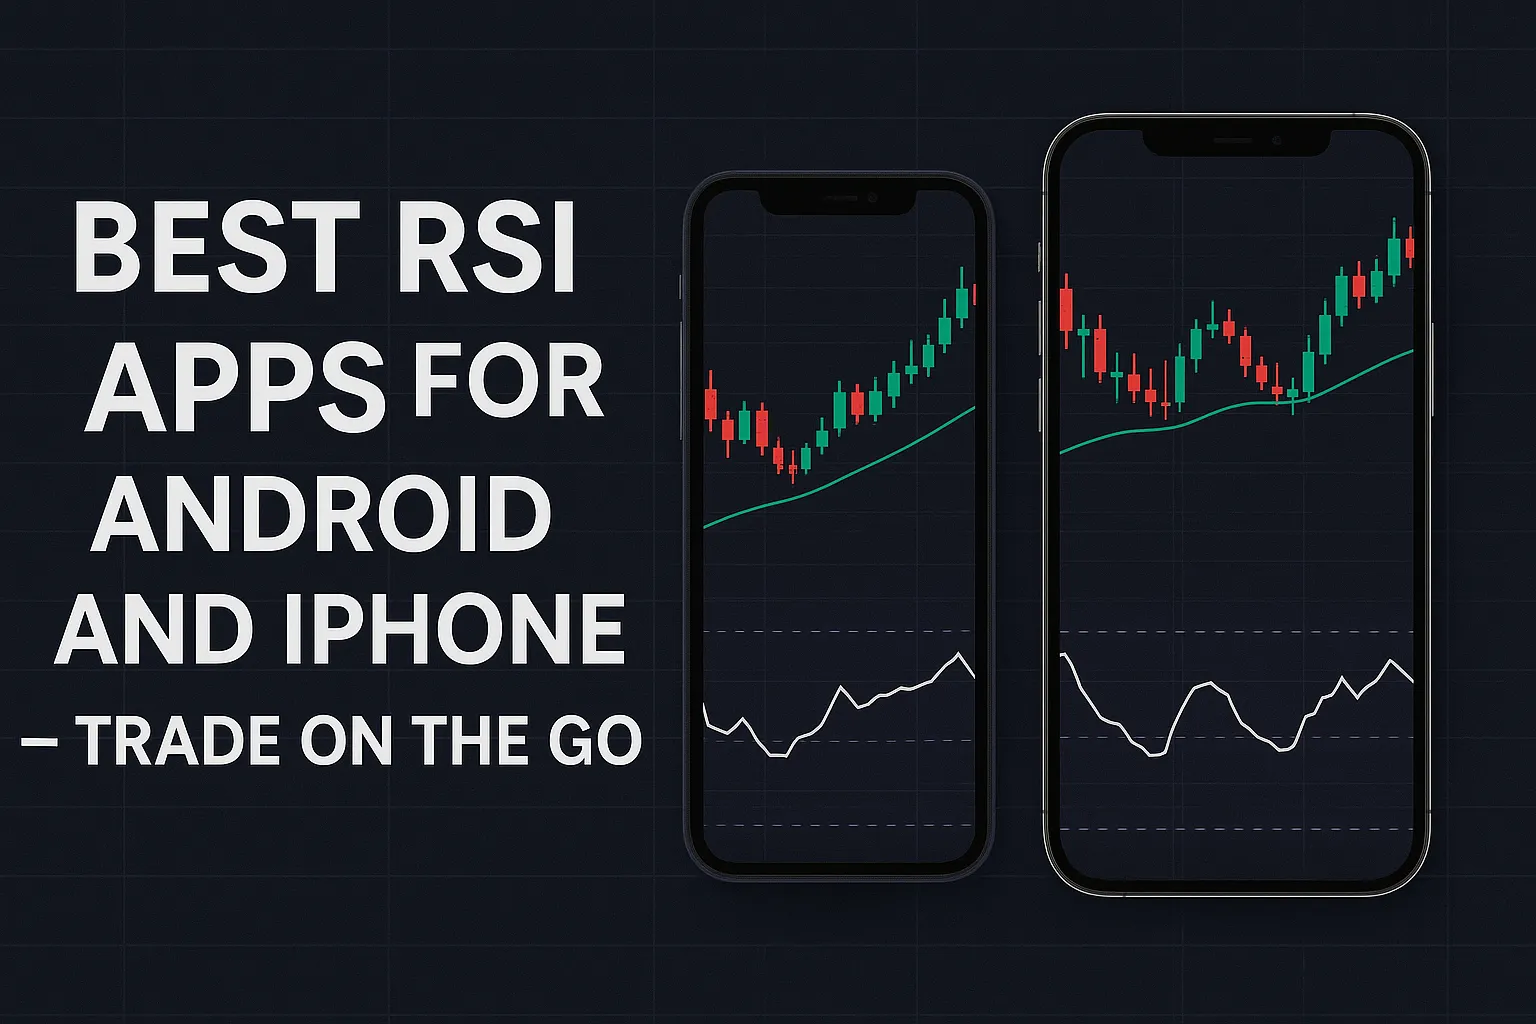
Best RSI Apps for Android and iPhone – Trade on the Go
Want to track RSI signals from your mobile device? Whether you’re on Android or iPhone, there are several RSI indicator apps that make it easy to monitor momentum, spot overbought/oversold levels, and manage trades in real time. Here’s a list of the top RSI apps for traders who prefer trading on the go. 1. TradingView App Available on: Android & iOSWhy it’s great: 📌 Ideal for stock, crypto, and forex traders 2. MetaTrader 4 / 5 (MT4 / MT5) Available on: Android & iOSWhy it’s great: 📌 Ideal for professional forex & commodity traders 3. Investing.com App Available on: Android
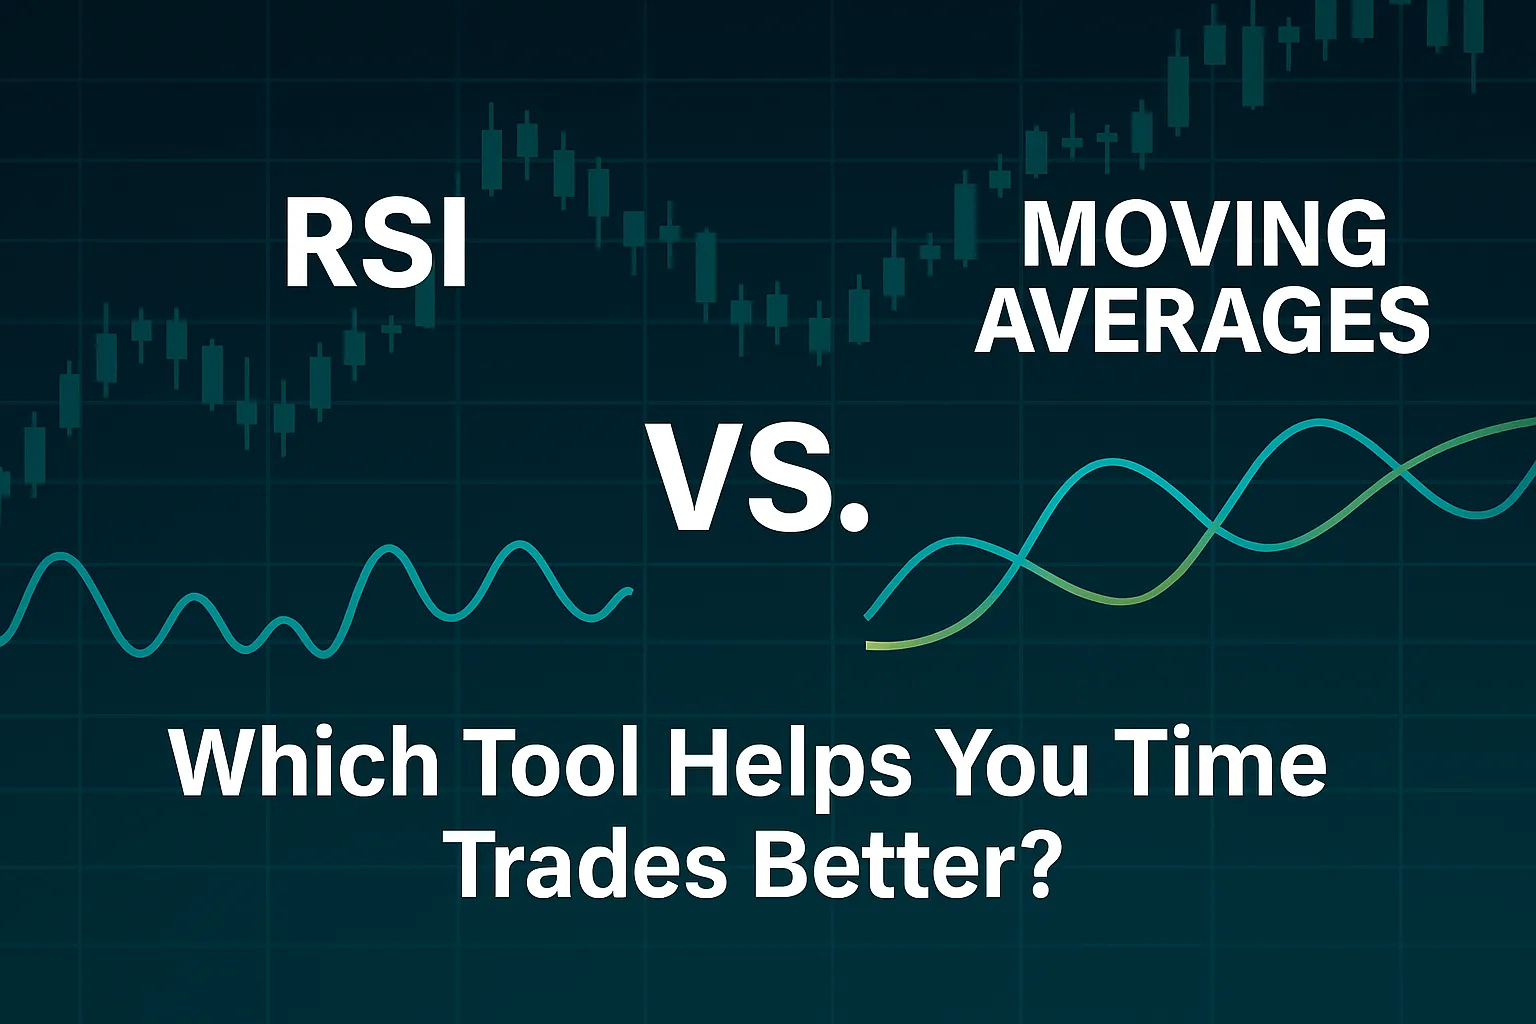
RSI vs Moving Averages – Which Tool Helps You Time Trades Better?
Both RSI and Moving Averages are powerful trading tools — but they serve different purposes. One measures momentum, while the other smooths out price data to identify trend direction. In this post, we compare RSI vs Moving Averages and help you decide which one to use based on your goals and strategy. What is RSI? The Relative Strength Index (RSI) is a momentum oscillator that tracks how quickly and strongly price has moved over a certain number of periods. What Are Moving Averages? Moving Averages (MAs) are trend-following indicators that calculate the average closing price over a specific period. RSI
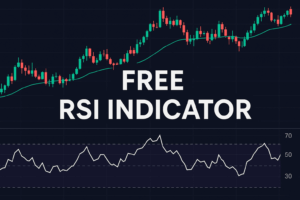
Free RSI Indicator PDF – Download the Ultimate Beginner’s Guide
New to RSI and want a simple, offline resource to learn from? We’ve created a free, easy-to-follow RSI Indicator PDF that explains how RSI works, how to use it, and how to apply it to your trades — whether you’re trading stocks, crypto, forex, or futures. What’s Inside the RSI PDF? ✅ What is RSI and how it works✅ RSI formula explained in simple terms✅ Buy and sell signal examples✅ Best settings for different markets✅ RSI strategies for beginners✅ Pro tips for avoiding false signals✅ Chart examples (with entry/exit setups) This PDF is perfect for beginners who want to learn

Best RSI Apps for Android and iPhone – Trade on the Go
Want to track RSI signals from your mobile device? Whether you’re on Android or iPhone, there are several RSI indicator apps that make it easy to monitor momentum, spot overbought/oversold levels, and manage trades in real time. Here’s a list of the top RSI apps for traders who prefer trading on the go. 1. TradingView App Available on: Android & iOSWhy it’s great: 📌 Ideal for stock, crypto, and forex traders 2. MetaTrader 4 / 5 (MT4 / MT5) Available on: Android & iOSWhy it’s great: 📌 Ideal for professional forex & commodity traders 3. Investing.com App Available on: Android

RSI vs Moving Averages – Which Tool Helps You Time Trades Better?
Both RSI and Moving Averages are powerful trading tools — but they serve different purposes. One measures momentum, while the other smooths out price data to identify trend direction. In this post, we compare RSI vs Moving Averages and help you decide which one to use based on your goals and strategy. What is RSI? The Relative Strength Index (RSI) is a momentum oscillator that tracks how quickly and strongly price has moved over a certain number of periods. What Are Moving Averages? Moving Averages (MAs) are trend-following indicators that calculate the average closing price over a specific period. RSI
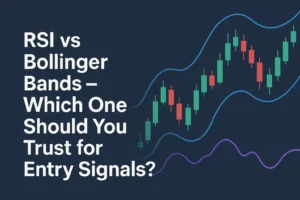
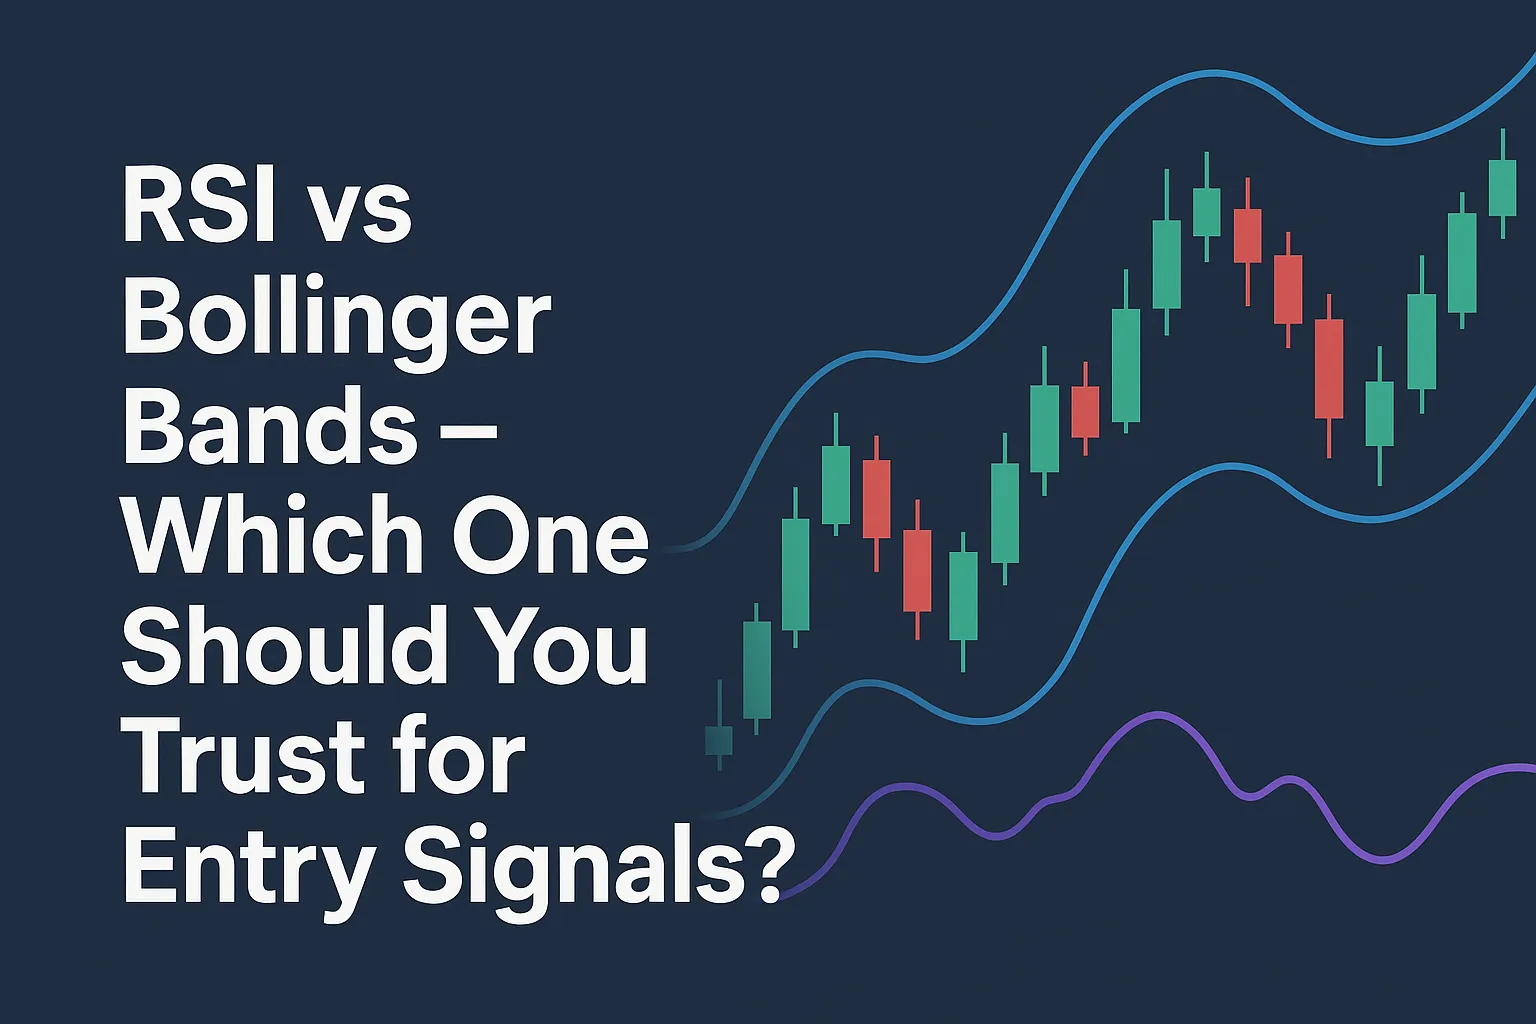
RSI vs Bollinger Bands – Which One Should You Trust for Entry Signals?
RSI and Bollinger Bands are both popular tools for spotting trade entries — but they work in very different ways. In this post, we’ll compare RSI vs Bollinger Bands, explain how each works, and help you decide which to use based on your trading style and market conditions. What is RSI? RSI (Relative Strength Index) is a momentum indicator that shows whether a market is overbought or oversold based on recent price changes. What Are Bollinger Bands? Bollinger Bands are volatility-based bands plotted above and below a simple moving average (SMA). RSI vs Bollinger Bands – Key Differences Feature RSI
RSI vs Stochastic – Key Differences and When to Use Each
Both RSI and Stochastic indicators are used to measure momentum — but they’re not the same. While they may look similar at first glance, each works based on different logic and performs best under different market conditions. This post compares RSI vs Stochastic in detail and helps you decide which one to use in your trading. What is RSI? RSI (Relative Strength Index) measures the strength and speed of price movement over a fixed number of periods. What is the Stochastic Oscillator? Stochastic compares a closing price to the price range over a given period. It’s more sensitive to price
RSI vs MACD – Which Indicator Is Better for Timing Trades?
RSI and MACD are two of the most widely used momentum indicators in trading — but they work very differently. In this guide, we’ll compare RSI and MACD side-by-side to help you understand their purpose, strengths, and when to use each. What is RSI? RSI (Relative Strength Index) is a momentum oscillator that measures how fast and how much price has moved in recent candles. What is MACD? MACD (Moving Average Convergence Divergence) is a trend-following momentum indicator based on the relationship between two EMAs. RSI vs MACD – Core Differences Feature RSI MACD Type Momentum Oscillator Trend-following Momentum Indicator
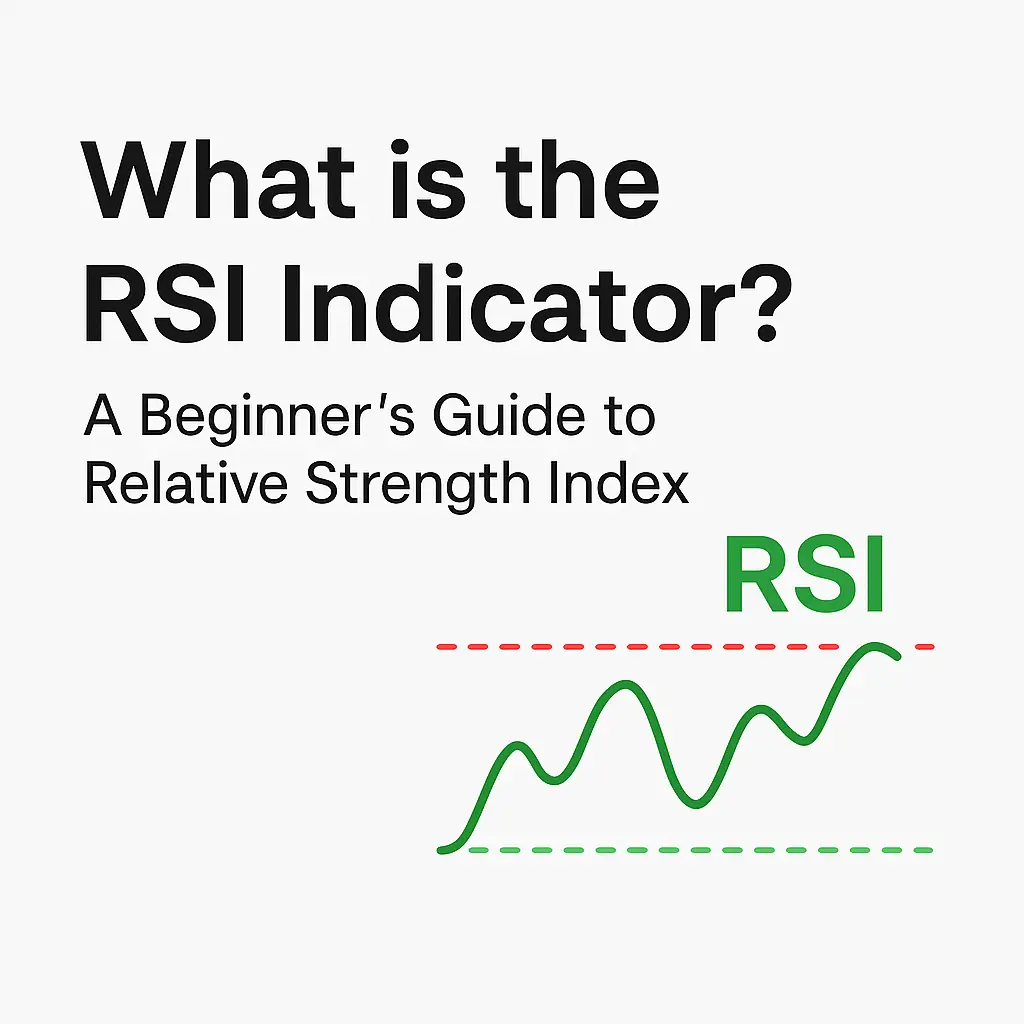


Free RSI Indicator PDF – Download the Ultimate Beginner’s Guide
New to RSI and want a simple, offline resource to learn from? We’ve created a free, easy-to-follow RSI Indicator PDF that explains how RSI works, how to use it, and how to apply it to your trades — whether you’re trading stocks, crypto, forex, or futures. What’s Inside the RSI PDF? ✅ What is RSI and how it works✅ RSI formula explained in simple terms✅ Buy and sell signal examples✅ Best settings for different markets✅ RSI strategies for beginners✅ Pro tips for avoiding false signals✅ Chart examples (with entry/exit setups) This PDF is perfect for beginners who want to learn
Free RSI Indicator PDF – Download the Ultimate Beginner’s Guide
New to RSI and want a simple, offline resource to learn from? We’ve created a free, easy-to-follow RSI Indicator PDF that explains how RSI works, how to use it, and how to apply it to your trades — whether you’re trading stocks, crypto, forex, or futures. What’s Inside the RSI PDF? ✅ What is RSI and how it works✅ RSI formula explained in simple terms✅ Buy and sell signal examples✅ Best settings for different markets✅ RSI strategies for beginners✅ Pro tips for avoiding false signals✅ Chart examples (with entry/exit setups) This PDF is perfect for beginners who want to learn
Free RSI Indicator PDF – Download the Ultimate Beginner’s Guide
New to RSI and want a simple, offline resource to learn from? We’ve created a free, easy-to-follow RSI Indicator PDF that explains how RSI works, how to use it, and how to apply it to your trades — whether you’re trading stocks, crypto, forex, or futures. What’s Inside the RSI PDF? ✅ What is RSI and how it works✅ RSI formula explained in simple terms✅ Buy and sell signal examples✅ Best settings for different markets✅ RSI strategies for beginners✅ Pro tips for avoiding false signals✅ Chart examples (with entry/exit setups) This PDF is perfect for beginners who want to learn